Stocks Near All-Time Highs Again
And just like that, stocks are trading near all-time highs again.
The S&P 500 and Nasdaq are above where they were before the conflict in Iran began. Uncertainty persists amid ceasefires and erratic peace talks.
At its lowest point on March 30th, the S&P 500 had declined about 9% from its January 27 all-time high. It has rallied 12% since then through April 29th.
A similar dynamic played out last year, when the S&P 500 fell nearly 19% at its worst point due to tariffs. Many feared that a sustained downturn and recession were inevitable. Ultimately, neither materialized and markets recovered over subsequent months.
This is not to suggest that every decline is short-lived or that the worst of the Iran conflict is over. Additional volatility remains possible in the weeks ahead. From an investment perspective, the last few weeks resemble prior periods in which geopolitical events created temporary disruptions. That said, from the human perspective the impact across the Middle East remains significant.
Since 1990, average market returns following 21 major geopolitical events have been as follows:
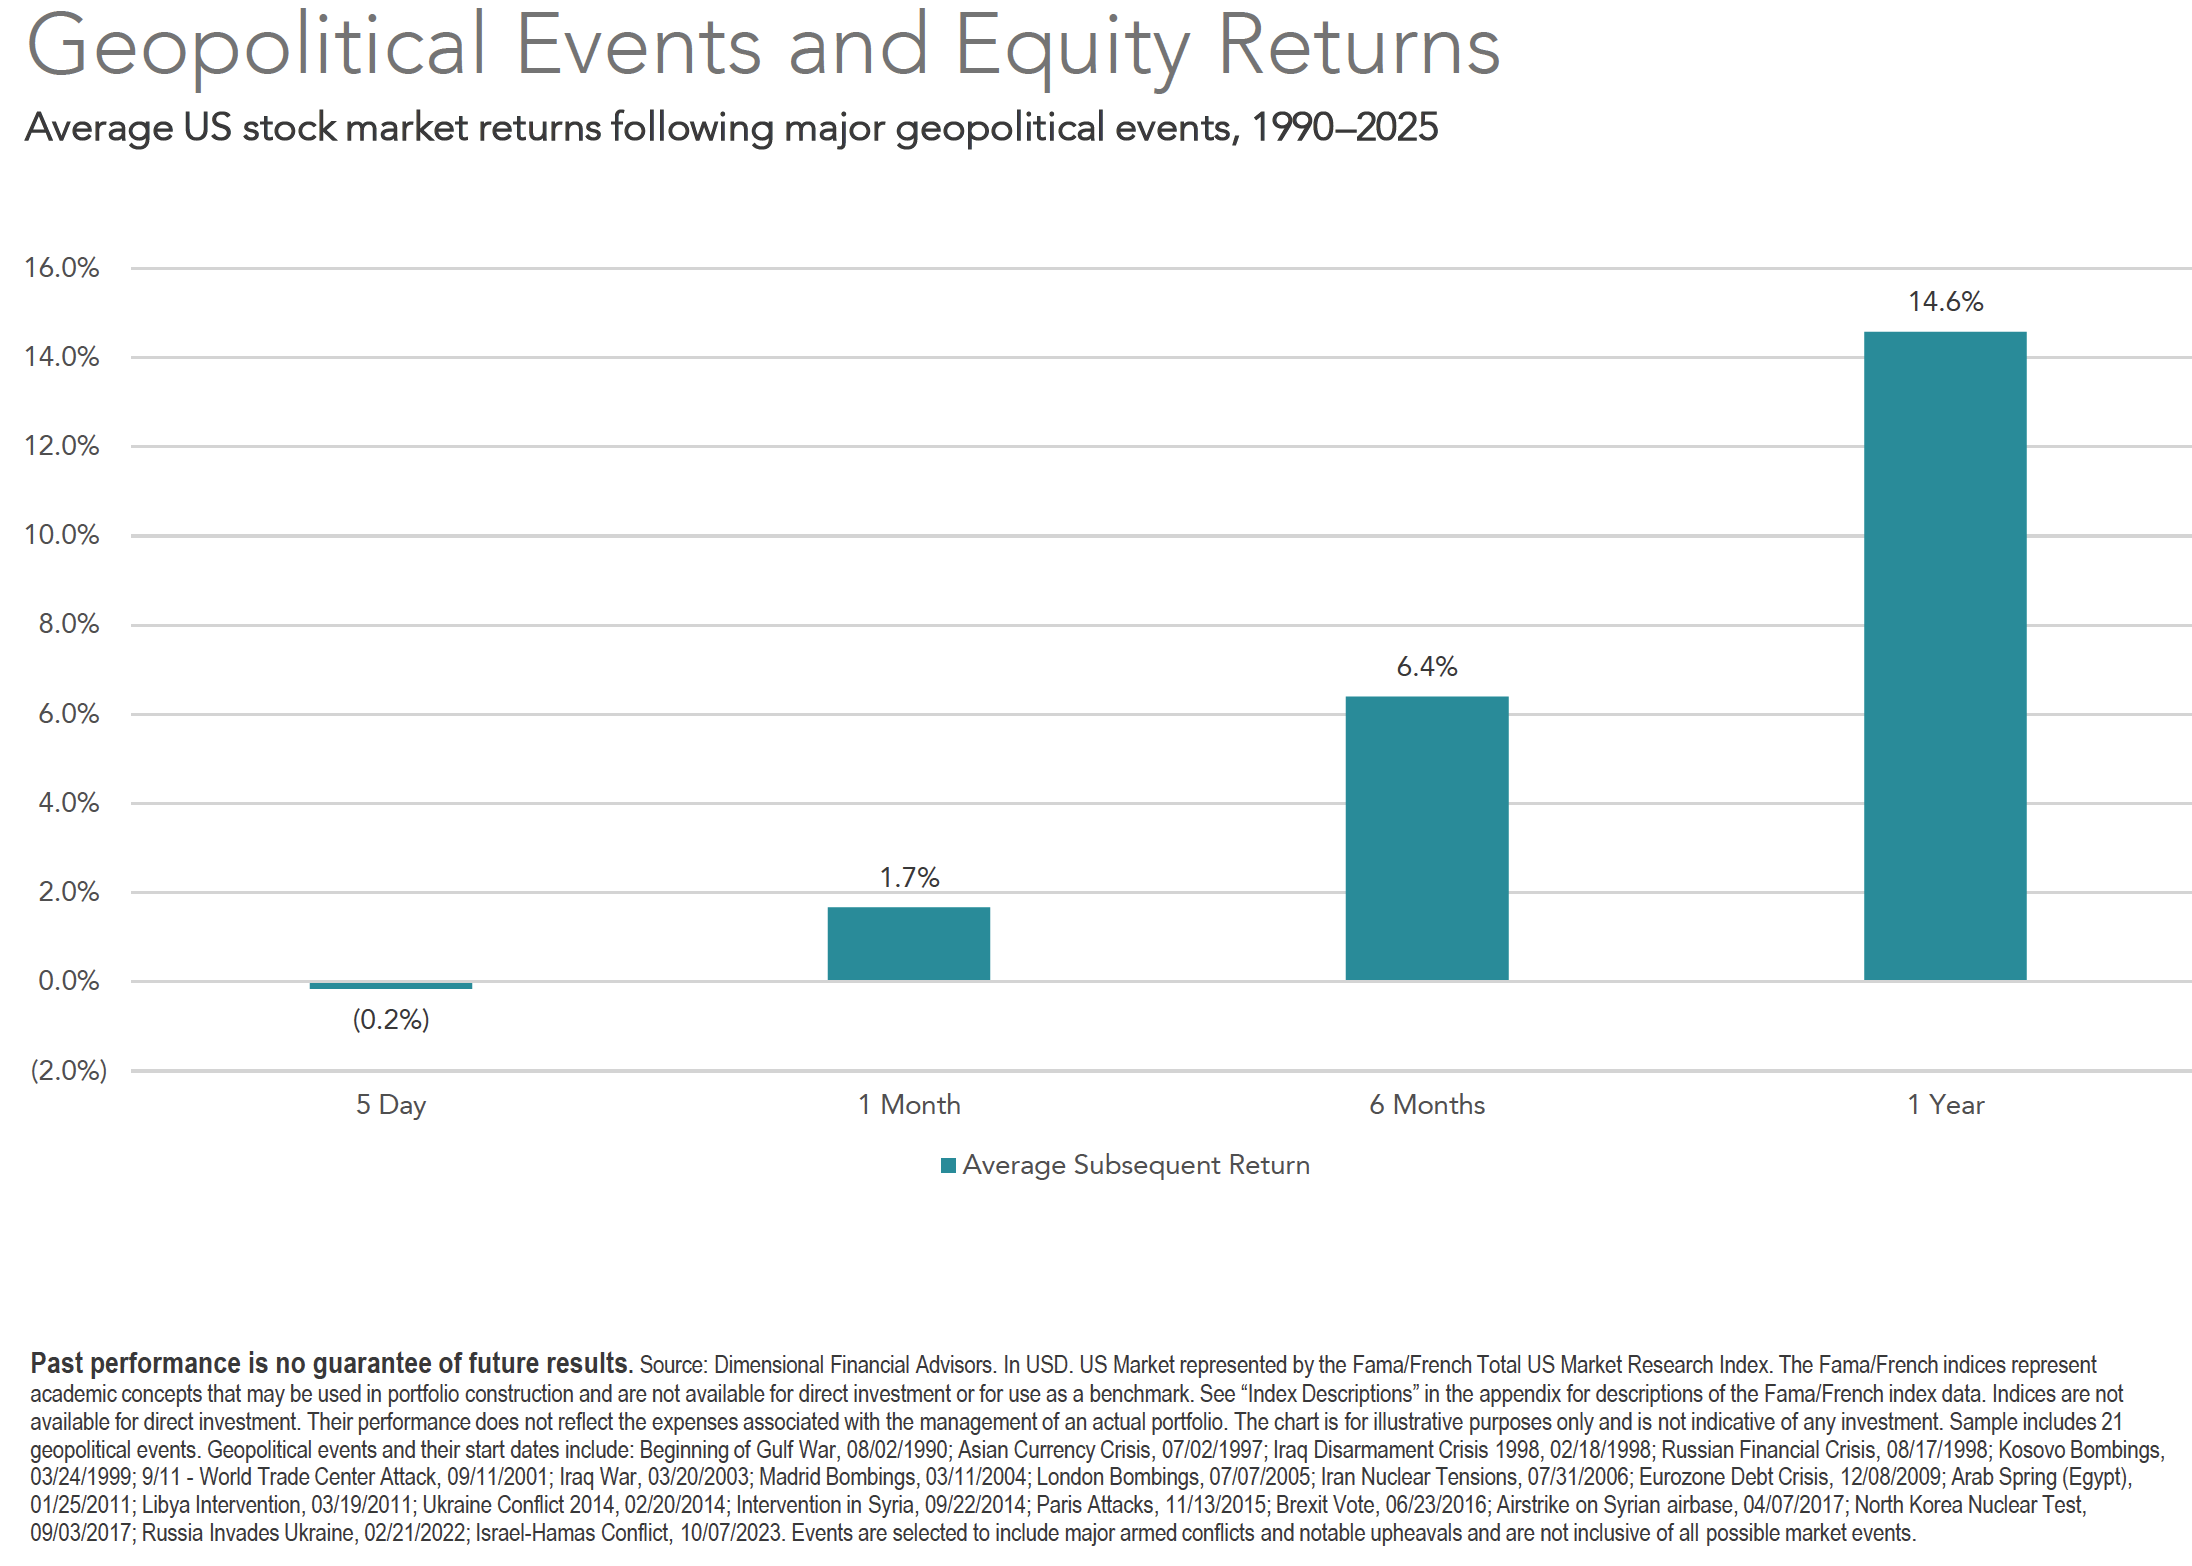
This data includes the Gulf War, 9/11, the Iraq War, the Arab Spring, the Russian invasion of Ukraine, and the Israel-Hamas conflict, plus the 15 additional events listed in the chart's footnote.
As illustrated in the chart, the average return of U.S. stocks was 14.6% one year following these major geopolitical events. By comparison, the compounded annual return of U.S. stocks over the entire 35-year period was 10.9%.
Periods of global tension can be uncomfortable for investors. They create market volatility; however, markets have repeatedly demonstrated resilience over the longer term.
**While my opening paragraphs reference the S&P 500, the historical data in the chart reflect the Fama/French Total U.S. Market Research Index. This index moved similarly to the S&P 500, with a correlation of 0.99 over the full period.
What About Inflation?
Oil prices remain volatile. Brent crude has traded in a wide range — from roughly $73 per barrel prior to the onset of the Iran conflict to as high as $112 in April.
U.S. retail gas prices have jumped from around $3 per gallon before the war to just over $4 today with noticeably higher prices in California. A key consequence is higher inflation. The latest Consumer Price Index report measured inflation at 3.3% in March— up from February's 2.4% reading. Energy prices alone jumped 12.5% year-over-year in March.The impact of higher energy costs on the broader economy will likely depend in part on how long the conflict in the Middle East lasts. Historically, supply-driven energy shocks have often proven temporary when price pressures remained concentrated in energy rather than spreading to other economic sectors.
The chart below examines inflation from a broader historical perspective:
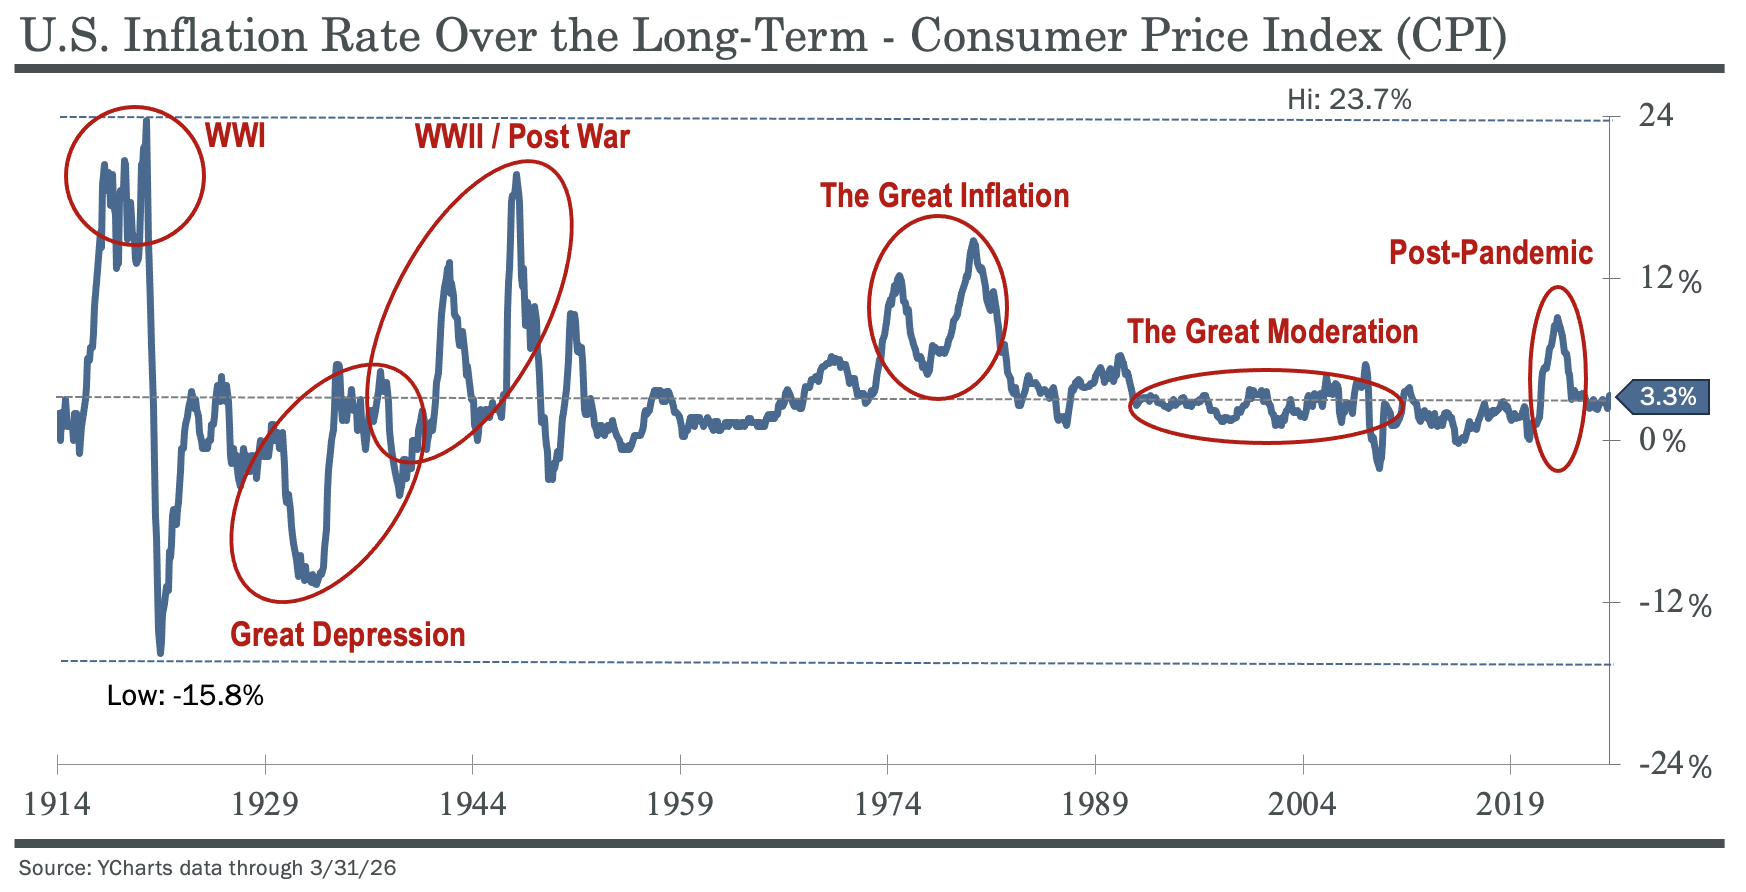
As illustrated above, U.S. inflation has been largely episodic over the last century. Inflation spiked during the two world wars and during the 1970s "Great Inflation." "The Great Moderation” saw relatively stable prices in the 1990's and 2000s. Prior to the conflict in Iran, inflation had been moderating from the post-pandemic inflationary surge. It's worth noting that March's 3.3% inflation measure is broadly in line with inflation's long-term historical average, despite recent increases in energy prices.
The rise in oil prices complicates matters for the Federal Reserve in setting monetary policy. The Fed’s core mission, known as its “dual mandate”, is to promote maximum employment and stable prices. While unemployment remained low at 4.3% in March, there are signs of a softening labor market, including monthly swings in U.S. non-farm payrolls (month-over-month).
At the start of 2026, expectations were for the Federal Reserve to cut rates two to three times by year end. However, inflation has remained above the Fed's 2% target across multiple measures leading up the to the Fed’s April 29 policy meeting. Oil prices and the uncertainty of the war in Iran have stoked inflationary fears and likely played a role in the Fed leaving short-term interest rates unchanged.
We continue to monitor the geopolitical situation and its investment implications closely.
Please don't hesitate to reach out if you have any questions.
If you have questions or would like to discuss further, please click the link below.
---
All content is for informational purposes only. It is not intended to provide any tax or legal advice or provide the basis for any financial decisions. Nor is it intended to be a projection of current or future performance or indication of future results. Past performance is no guarantee of future results. Purchases are subject to suitability. This requires a review of an investor’s objectives, risk tolerance, and time horizons. Investing always involves risk and possible loss of capital. Opinions expressed herein are solely those of Darrell Capital Management, LLC. The information has been derived from sources believed to be reliable but is not guaranteed as to the accuracy and completeness and does not purport to be a complete analysis of the materials discussed. All information and ideas should be discussed in detail with your financial, tax and legal advisors prior to implementation. The information contained herein should be in no way be construed or interpreted as a solicitation to sell or offer to sell advisory services to any residents of any state other than the State of California or where otherwise legally permitted. Advisory services are offered by Darrell Capital Management, LLC, an Investment Advisor in the State of California. Being registered as an investment advisor does not imply a certain level of skill or training. Social post reactions and comments should not be viewed as endorsements or testimonials.